|
Which web image
gives a more professional appearance?
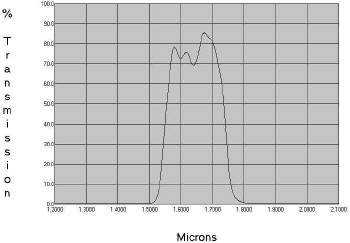 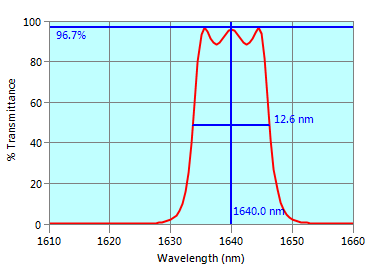
Unaltered image on left from (FilmStar nonuser) online filter
catalog
|
This page supplements material in
FilmStar/Scantraq printed or online manuals. While the FSPlot Module might seem
straightforward, there are numerous hidden features, all of which can be tested
in the Free Version. Note that
graphs can be automated so that production technicians need have no knowledge of
the inner workings.
Already familiar with FSPlot
Appearance?
Additional pages: Legends,
Annotations,
Formulator, Customizer
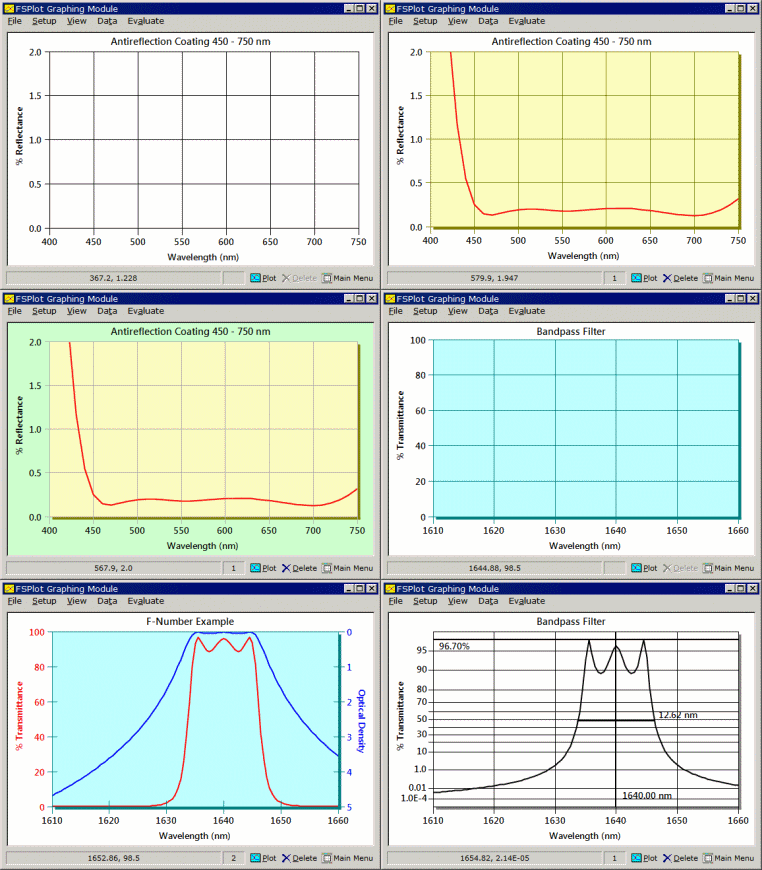
As can be seen, there are many options.
- Appearance adjustable for web
pages, PowerPoint or printed documents. Note the light green graph
border which we make much use of on this website.
- Legends for labeling
multiple
plots. Here we label AR plots with angle.
- Annotations marking features such
as bandwidth and center wavelength. Most important is the ability to
draw these automatically.
- Possibility to plot both OD and
%T.
-
Diabatic
transmittance scale which is unsurpassed for clearly indicating the
behavior of filters with blocking zones.
- Possibility of background company
logo (will impress upper management).
Click here
to download an Excel file showing further options. |
 |
The FSPlot Module is the same in
DESIGN and MEASURE (SQPlot in Scantraq). Click its toolbar icon or Tools..
FSPlot Module <F4>. Once in FSPlot, click Plot <Alt+P> to add
a spectrum to the graph. Any number of spectra can be added (there is a limit,
but it is very high) and 12 lines can be labeled with legends.
Click Setup.. Graph Details <Ctrl+H>
to access the Graph Details dialog. The dialog can be kept open as
you explore multiple options. Move the box out of the way to see
what is happening.
Try different fonts. Segoe UI Semibold seems a good choice. Try
Title Font size 105 or 110 with Axes Font size 100. After you close
Graph Details, click <F4> and <F5> to adjust all font sizes together.
At this point you might be worried that there are so many choices that
you run risk of never being able to reproduce the same graph (including
window size).
Fortunately there is a way to reproduce all aspects of appearance - to
be discussed below.
Should Background..Color have no effect it's because
Bitmap/Gradient mode was enabled. Scroll down to that section (Graph
Detail 3) and set Enable to False. |
Graph Detail 1 |
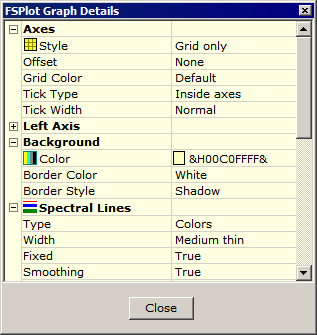
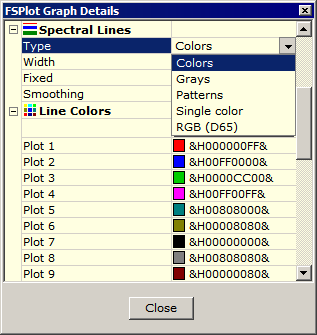
Some choices have pull-downs as shown
on the right. Grays and Patterns (solid, dashed, etc.) are
intended for monochrome printing. Single Color is intended for
tolerancing in DESIGN's FSPlot: Evaluate.. Tolerancing.
Another choice, intended for color-shift coatings is RGB.
Click
here for an example.
Some options give a gray box ...
which opens a dialog. Try that for Line Color. Note that we modified
Plot 3 to be slightly darker than the usual light green. Try that for
yourself. Up to 12 colors can be defined.
Think this is all 'too much'? Line Color choice was added to meet the
requirements of a user printing a coating catalog using two colors:
green and black. |
Graph Details 2 |
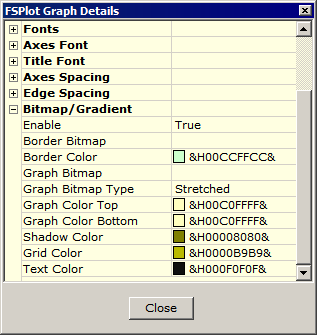
Bitmap/Gradient mode adds to
the possibilities. Setting Enable to True overrides Background
Color and Border Color (Graph Details 1). A different
Graph Color Top and Bottom gives a color gradient.
A Graph Bitmap (*.bmp) logo is possible, but it can detract from
clarity. Graphics software can be utilized to turn bright logos into dim
watermarks.
Border Color is very useful to match web pages (as we do with our
light green background) or
PowerPoint.
Are these trivial matters?
Click here.
Graph Details are saved in INI files and not in FILM Archive or Scan
Method files. Opening a new design does not change appearance. |
Graph Details 3 |
When using FSPlot one might want
to utilize the same graph in a website, PowerPoint presentation, printed
catalog, QA report. Each end-use requires different Graph Details. In the main
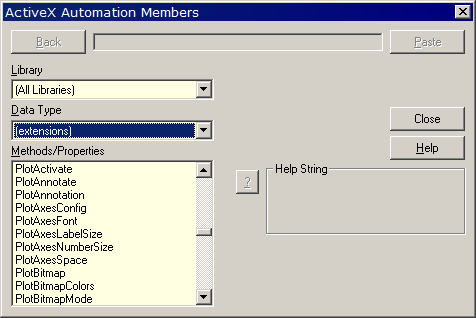
program window, click Tools.. BASIC Editor <F6> and then Debug..
Browse (or Browse Object icon) and scroll down to Plot..
commands. Note the large number of settings corresponding to Graph Details,
documented in Design Reference.. FilmStar BASIC.. FilmStar DESIGN (MEASURE)
Extensions.
Fortunately there's no need to
master these obscure settings because FSPlot creates the code for you. Click
File.. Create BASIC Code and paste into Sub Main o (recommended) a separate
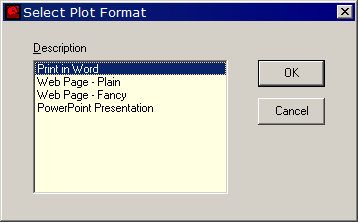
subroutine. The code listing is displayed below. The Plot Format dialog is
generated by PlotConfig.bas (included in the FilmStar installer). This is a
handy way to define formats that will be used repeatedly.
Sub PlotSetup
    ' FSPlot graph setup code:
    PlotConfig 9273545, 32128, 0
    PlotSize 8670, 6585, 95
    PlotTitleFont = "Segoe UI Semibold"
    PlotTitleSize = 110
    PlotLegendSize = 100
    PlotLegendSimple = False
    PlotAxesFont = "Segoe UI Semibold"
    PlotAxesLabelSize = 100
    PlotAxesNumberSize = 100
    ' etc.
End Sub
|
c:\Winfilm\Basic32\PlotConfig.bas |
Try the
FSPlot Customizer
(File.. Customize <Ctrl+U>). This saves formats in ..\Config\Common.ini
thus enabling plot setup to be shared by DESIGN and MEASURE. It's the
same BASIC plot setup code, but easier to deal with.
The FSPlot File Menu
includes some options requiring further comment:
-
Save As
- PNG (portable network graphics) is recommended for web and
printed graphics. WMF may be useful if vector graphics are
needed, but thorough testing is required as fonts and line
thicknesses may not scale as intended. Save as BMP only when
necessary as file size will be very large.
-
Graphics Mode
- Sets mode for copying to clipboard. There is
no difference between BMP and PNG.
-
Bitmap Size
- Use 100% for web pages. 200-300% is intended for printed documents
and gives smooth fonts without the need for the less WSIWYG WMF
vector format. Ultimately,
as shown here,
WMF gives the highest quality scalable fonts.
-
Disable Save
- Check only if you have made temporary Graph Details adjustments
which you don't want saved when you exit DESIGN or MEASURE.
Top of Page
II - Legends
III - Annotations
IV - Formulator
Issues/FAQ
|


